
Wix Answers Help Center
Customer Satisfaction (Insights)
For an introduction to the insights dashboards, see Insights Overview.
The Customer Satisfaction dashboard is a tool to help you analyze your customers' satisfaction responses over time, enabling you to address systemic issues with your ticket handling. You can breakdown satisfaction responses by the interactions of team member, team, location, and so forth, and you can apply numerous filters for highly-specific looks into user satisfaction and comments.
To get started:
Hover over the Insights icon  in the side panel and click Customer Satisfaction.
in the side panel and click Customer Satisfaction.Dashboard Overview
Dashboard Sections
The Customer Satisfaction dashboard displays the following sections. For information about the data, see Dashboard KPI Explanations.
- Filters

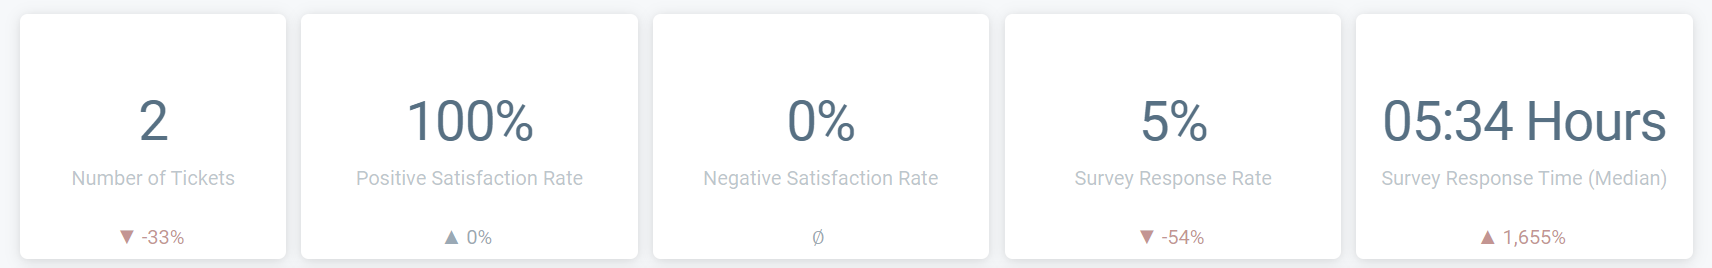
- Tiles that display summary information about survey responses and satisfaction rates for the interactions specified by the filters during the time period specified by the Date filter. Additional small arrows and percent figures appear at the bottom of each tile indicating the percent change from the previous time period specified by the Compare To filter.
For the comparisons, green indicates a desirable change (higher or lower), red indicates an undesirable change compared to the period selected in the Compare To filter. Percentages are floored to the nearest integer.
- Looks that display graphical information about survey responses and satisfactions. The looks include:
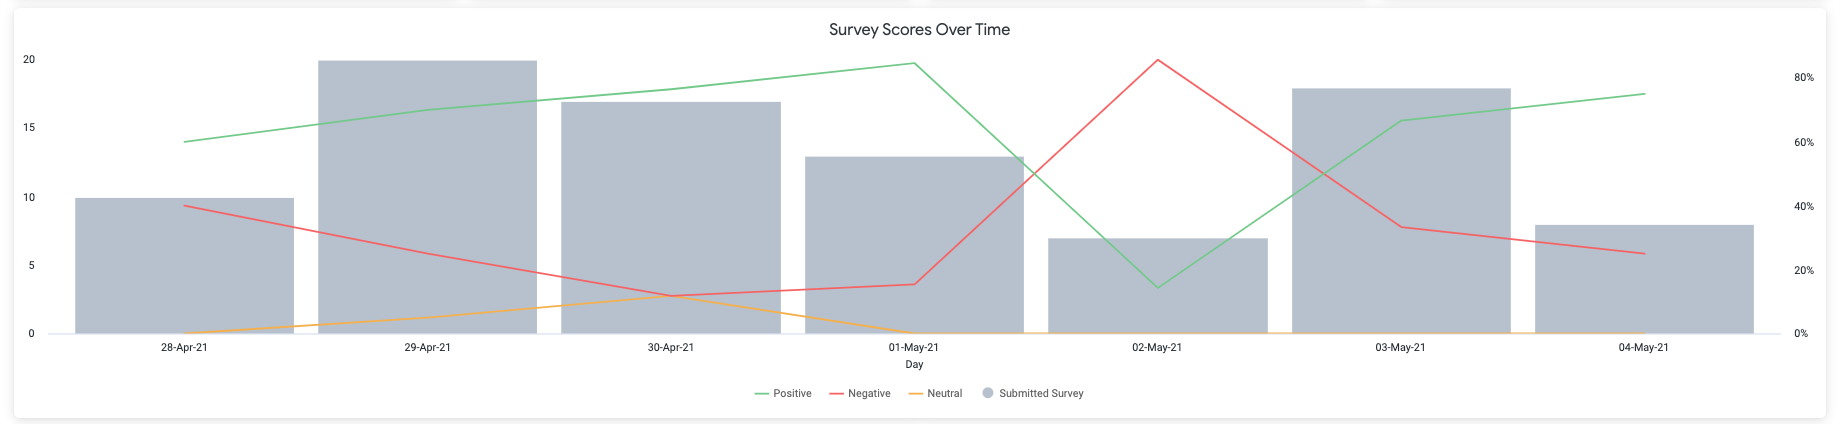
- Survey Scores Over Time: A chart of satisfaction, by percentage of responses, over time.
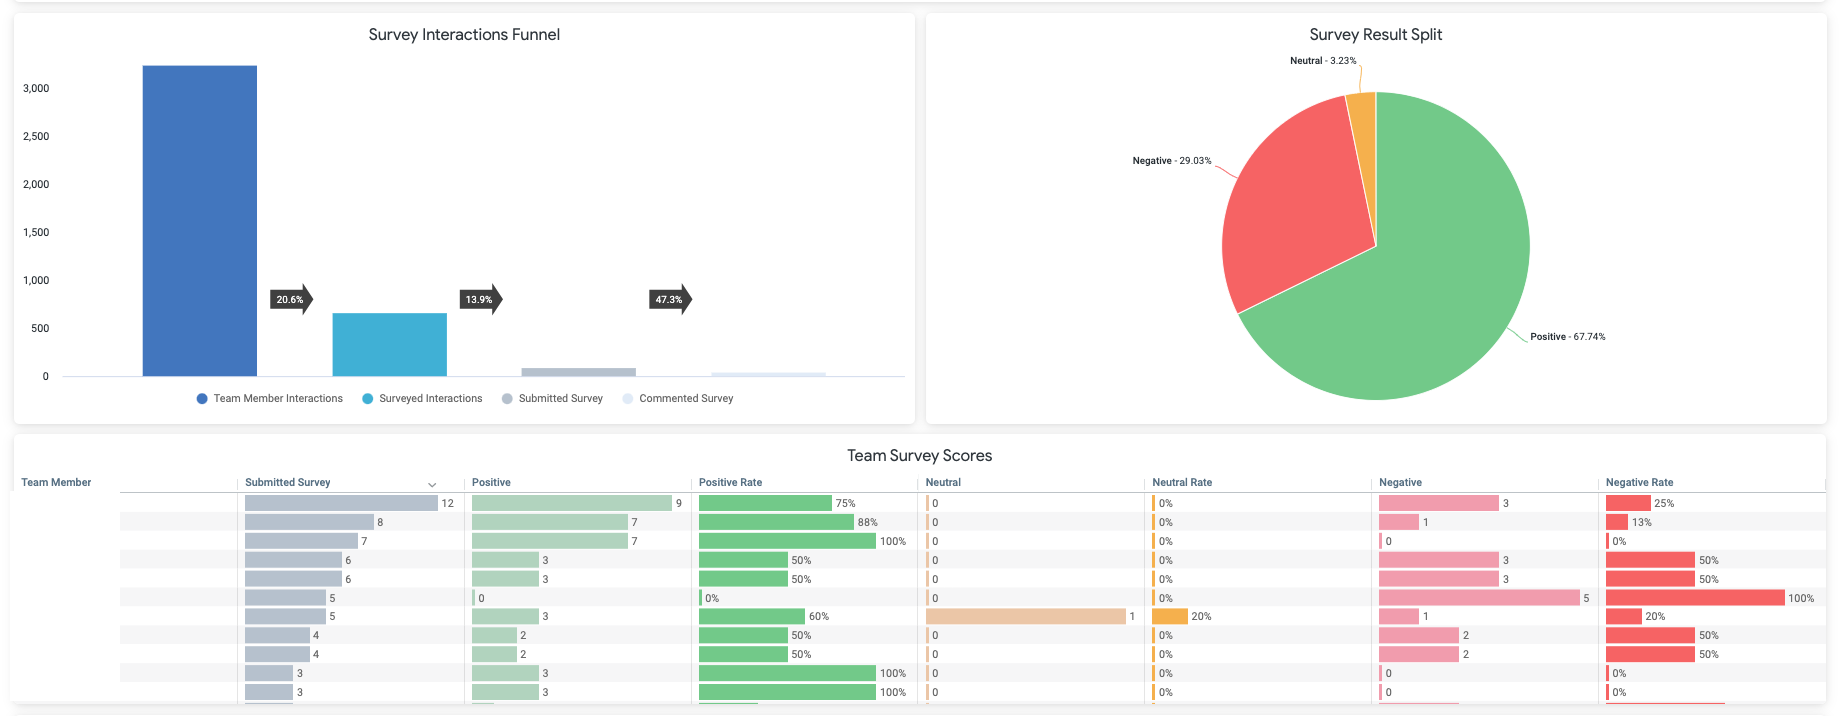
- Survey Interactions Funnel: A graphical view of how many team member interactions resulted in how many surveyed interactions, which in turn resulted in how many survey submissions (with a satisfaction score), which in turn resulted in how many of these submissions also had comments. Note that the View Data By Date filter has no effect on this look.
- Survey Result Split: A pie chart comparing positive, neutral, and negative satisfaction scores
- Survey Scores: A table displaying positive, neutral, and negative scores for each entity (such as assignee, team member, location, and so forth), according to the option selected in Breakdown By.
- A Survey Comments table, where each row is a survey response.
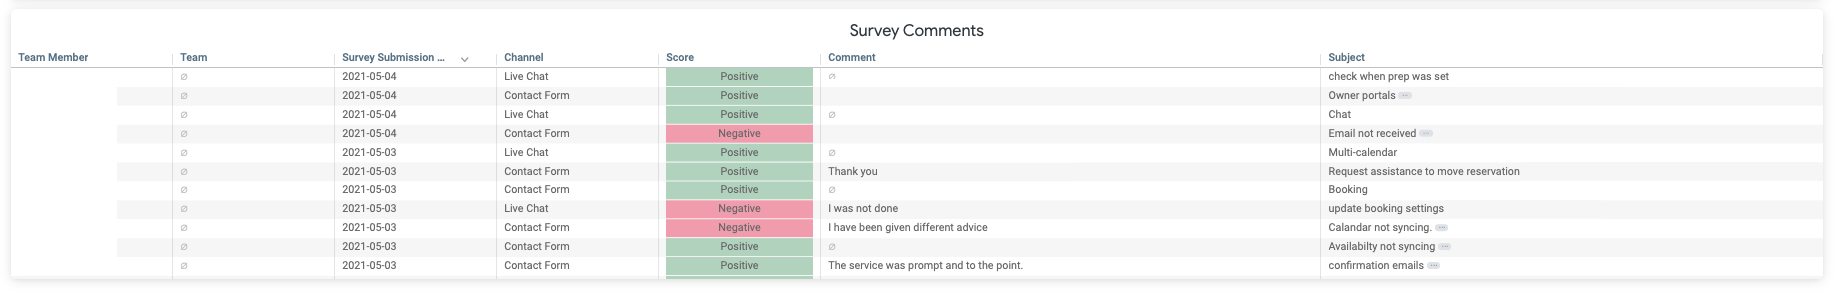
For general actions you can perform on this table, see Table Actions. Click the value in a column header or cell to view more information about the interactions (see Viewing Look Data (Drilling Down)).
Dashboard KPI Explanations
- Team member interactions: Any phone ticket, chat session, or ticket reply made by a team member.
- Surveyed interaction: A team member interaction that resulted in a survey presented or sent to the user.
- Surveyed interaction rate: The number of surveyed interactions divided by the total number of team member interactions.
- Survey response rate (or submission rate): The number of survey responses including a satisfaction rating divided by the total number of surveyed interactions.
- Comment rate: The number of survey responses with comments divided by the total number of responses.
- Survey response time: The time between when a survey is presented or sent to the user and the time the user sent the response.
- Positive / neutral / negative (number): The number of surveys reporting a positive / neutral / negative satisfaction rating.
- Positive / neutral / negative (rating): The number of surveys reporting a positive / neutral / negative satisfaction rating divided by the total number of surveys reporting.
Viewing Look Data (Drilling Down)
Click a cell, data point, line, or area in a look to open complete information about that data. A new pane appears with the data in a table. If the data you are interested in contains more than 500 lines, only the first 500 lines appear in the table.
Show me how to use this table:
Filtering the Data
Set date ranges and select filters at the top of your dashboard to modify the displayed data. Note: a survey's date is calculated from the time that the survey is sent or presented to the user.
To filter your statistics:
 to refresh the dashboard with the new filter settings.
Was this article helpful?