
Wix Answers Help Center
Ticket Insights
Analyze extensive ticket data from your Ticket Insights dashboard. Set time ranges, apply filters, and select metrics in your graph or table to identify key areas your business can improve upon.
Ticket metric calculations:
Your Ticket Insights dashboard includes all ticket types (deleted, merged, snoozed, spam) and tickets created/updated by agents, Automatic Actions, or Spotter. Learn how ticket metrics are calculated differently in other areas of Wix Answers.
To get started:
Hover over the Insights icon  in the side panel and click Tickets.
in the side panel and click Tickets.Filtering Your Statistics
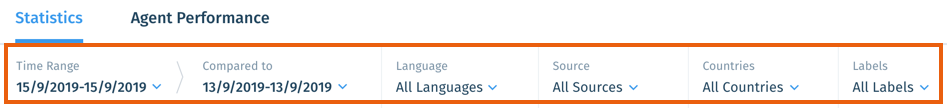
Set date ranges and select filters at the top of your dashboard to modify the displayed data.
To filter your statistics:
- Time Range: Click the Drop-down icon
 and select a predefined or custom date range:
 - Predefined: Select a date range on the left (e.g., Last 7 Days) and click Apply.
- Custom: Click the start date on the calendar, then the end date, and click Apply.
- Compared to: Click the Drop-down icon and select the end date on the calendar for your comparison date range.
- Language: Click the Drop-down icon and select a ticket language to include.
- Source: Click the Drop-down icon and select the ticket sources to include (e.g., Web, Email).
- Countries: Click the Drop-down icon and select the ticket countries to include.
- Labels: Click the Drop-down icon and select the ticket labels to include.
Percentage difference stats:
The difference between the "Time Range" and "Compared to" date ranges appears to the right of each statistic on your dashboard. 
Viewing Your Ticket Insights Charts
Select a heading to analyze its ticket statistics in a chart. Each heading on your chart displays data for the time range you selected.
Choose from the following charts:
- New Tickets: View a chart displaying the number of new tickets created.
- Reopened Tickets: View a chart displaying the number of reopened tickets.
- Agent Replies: View a chart displaying the number of agent replies.
- Closed Tickets: View a chart displaying the number of closed tickets.
- Closed by Merge: View the total tickets that were merged for each day.
- Solved Tickets: View a chart displaying the number of solved tickets.
- Response Time (Median): View a chart displaying the average ticket response time by agents.
- Satisfaction Score: View the daily percentage of replies rated by customers as "helpful" out of the total rated replies. Learn more about customer ratings.
Use the following features to review your charts:
- Click the relevant subheading to compare your data By Source, By Country, or By Label.
Show me an example

- Hover over the chart for detailed information at specific times.
Show me an example
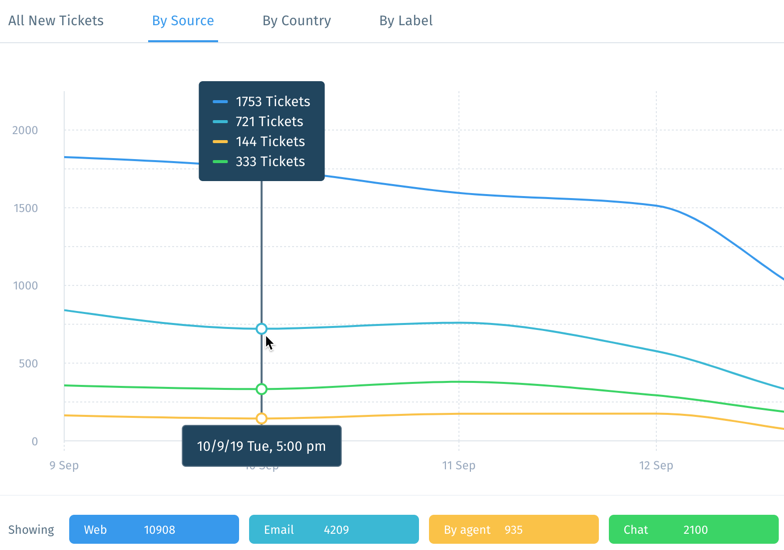
- Click a statistic next to Showing to hide it from the chart.
Show me an example

Viewing Your Ticket Insights Table
Scroll down to view your ticket statistics in a table. Here you can click a heading to compare data by Country, Source, or Labels.
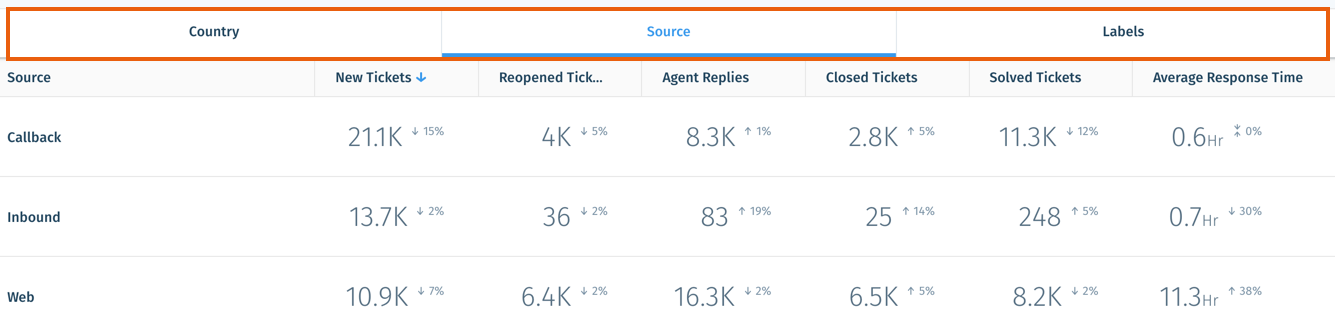
Tip:
Click a subheading (e.g. New Tickets) to sort the data from highest to lowest or vice versa.
Was this article helpful?