
Wix Answers Help Center
Traffic Overview
For an introduction to the insights dashboards, see Insights Overview.
The Traffic Overview dashboard is a tool to help you analyze your company's ticket and interaction flow over time, enabling you to optimize your team members assignments and support KPIs.
To get started:
Hover over the Insights icon  in the side panel and click Traffic Overview.
in the side panel and click Traffic Overview.Dashboard Overview
The Traffic Overview dashboard displays the following sections:
- Filters
- Tiles that display summary information about interactions, tickets, and FCR rates for tickets matching the filters. A 60% FCR indicates that 60% of the tickets are FCRs.

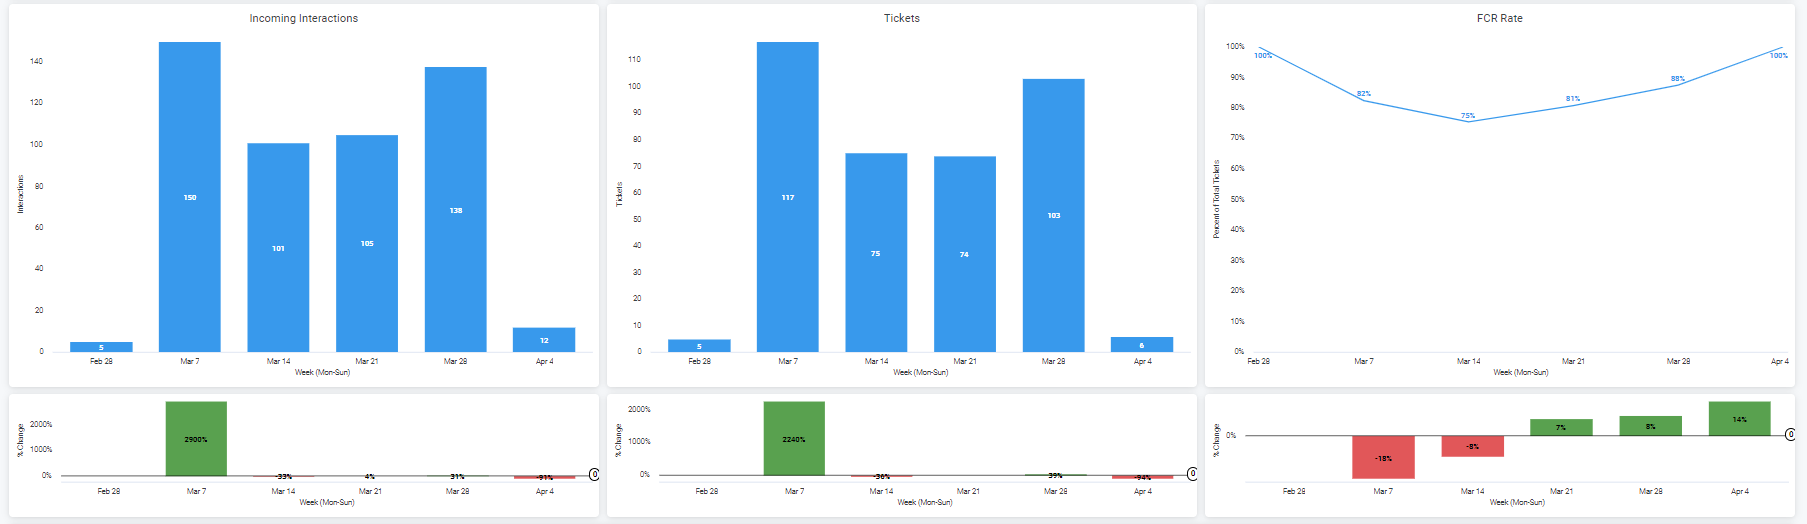
- Looks that display graphical information about interactions, tickets, and FCR rates matching the filters, as well as percent changes to these. The graphs include multiple totals if you apply a breakdown in the filters.
- A tile that displays a table with interactions for each hour and day for interactions matching the filters, in order to help you plan your team members workload.
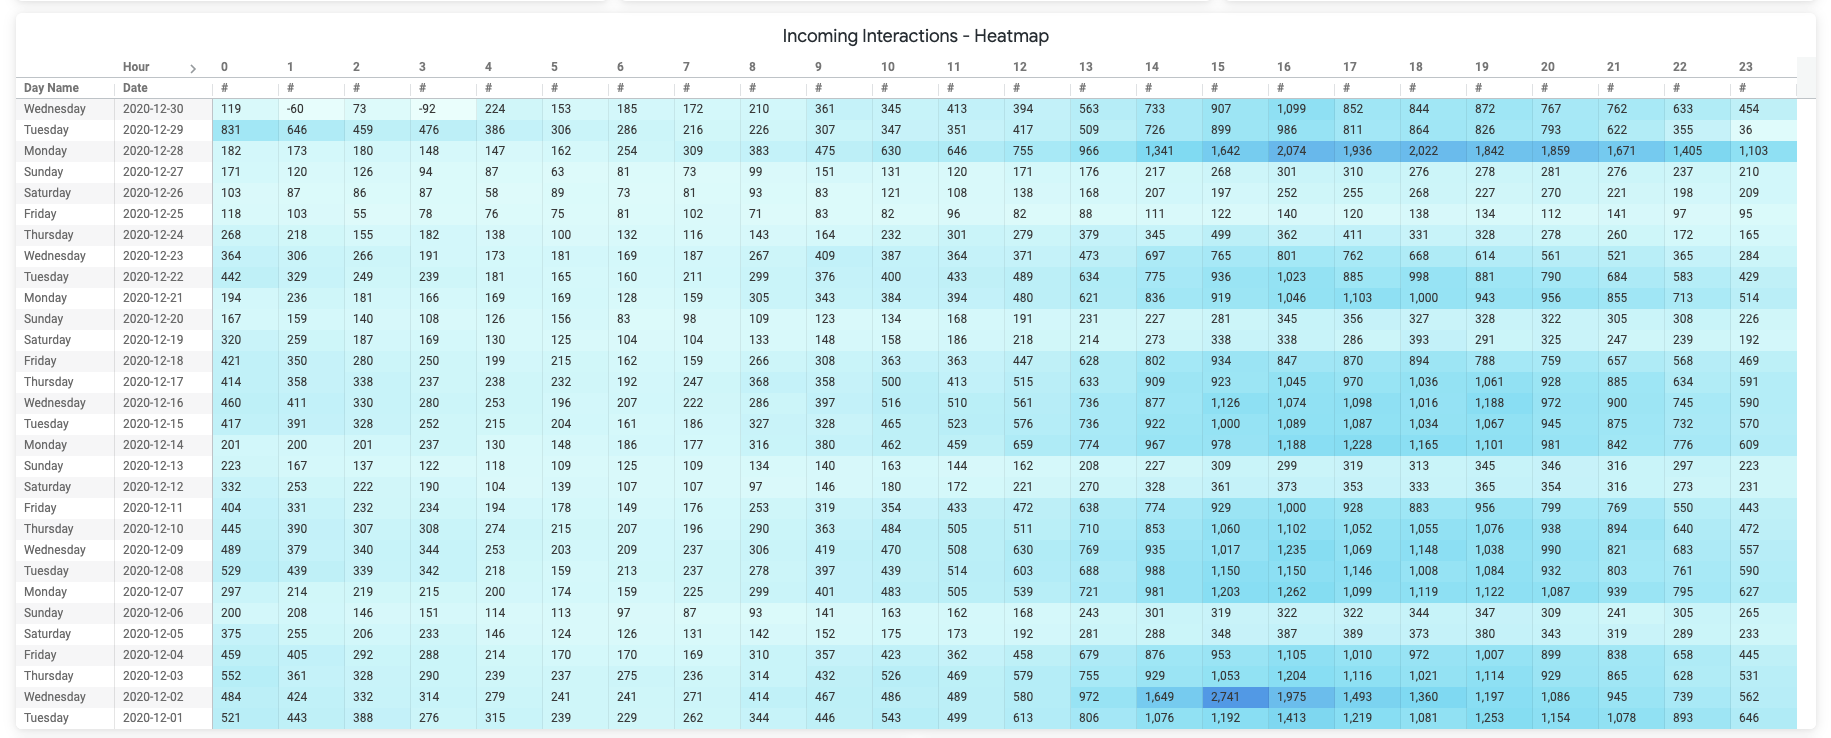
For general actions you can perform on this table, see Table Actions. Click the value in a column header or cell to view more information about the interactions (see Viewing Look Data (Drilling Down)).
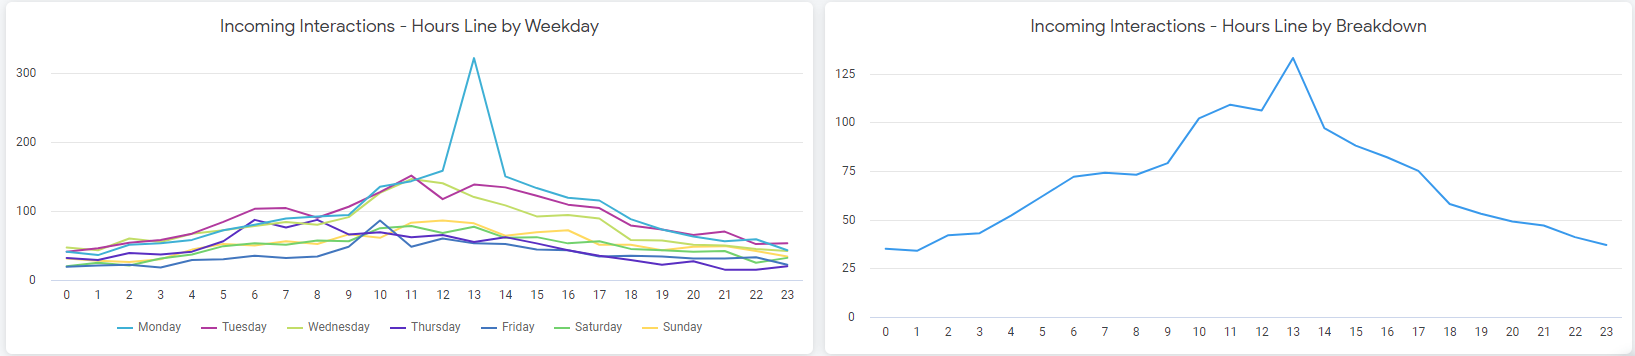
- Looks that display the average number of interactions for each hour for each weekday for interactions matching the filters.
Viewing Look Data (Drilling Down)
Click a cell, data point, line, or area in a look to open complete information about that data. A new pane appears with the data in a table. If the data you are interested in contains more than 500 lines, only the first 500 lines appear in the table.
Show me how to use this table:
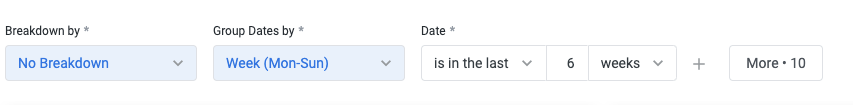
Filtering the Data
Set date ranges and select filters at the top of your dashboard to modify the displayed data.
To filter your statistics:
 to refresh the dashboard with the new filter settings.
Was this article helpful?