
Wix Answers Help Center
SLA Ticket Insights
Check how well your team meets Service Level Agreement (SLA) goals with SLA Ticket Insights. Here you can analyze SLA ticket data in various charts using filters and comparison date ranges.
Get started:
Hover over the Insights icon  in the side panel on the left and click SLA.
in the side panel on the left and click SLA.Step 1 | Set the Time Range of Your Data
Choose a preset or custom time range for the SLA data you'd like to view. Then choose the comparison time range that your data snippets will use to compare the metrics over time.
Show me where the "Compared to" data displays
To set the time range of your data:
- Hover over the Insights icon in the side panel and click SLA.
- Click the Time Range drop-down at the top and select a preset or custom date range for calculating the data:
- Preset date range: Select a preset date range on the left and click Apply.
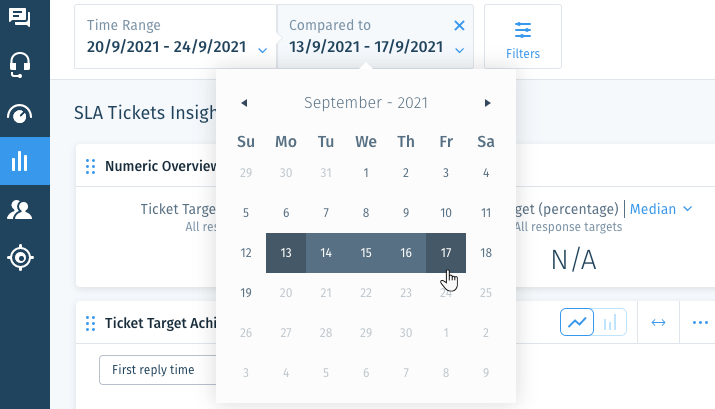
- Custom date range: Select the 1st and last dates on the calendar in which you want to calculate the data, then click Apply.
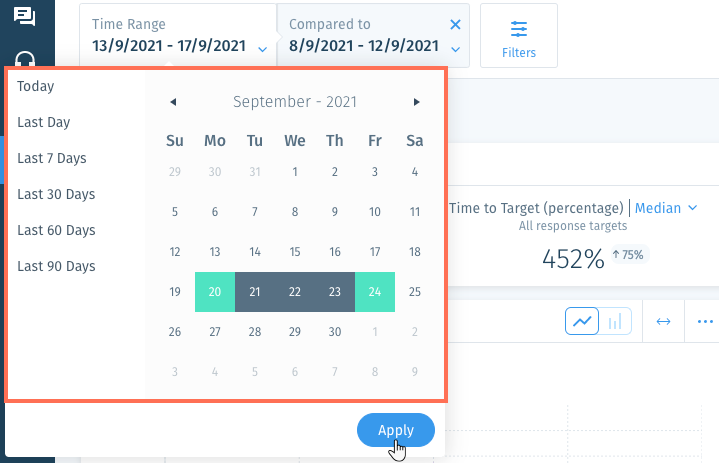
- Choose the Compared to date range that your selected Time Range will be compared to in the data snippets:
Note: Alternatively, you can click the X next to Compared to if you don't want to compare your Time Range data with another period of time.- Select the last day of the Compared to date range from the calendar.
Note: The Compared to date range is always the same amount of time as your selected Time Range.
- Click anywhere outside of the calendar to close it.
- Select the last day of the Compared to date range from the calendar.
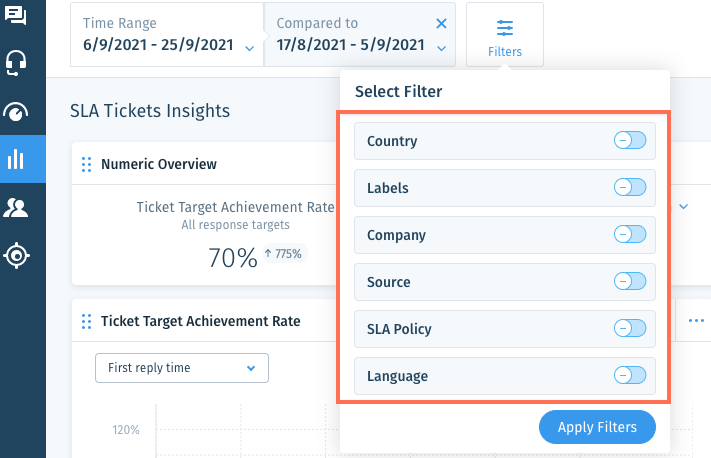
Step 2 | Add Filters to Your Data
Add filters if you want the data to only include certain types of tickets. For example, you could add the Company and SLA Policy filters to only show tickets from specific companies that have specific SLA policies applied to them.
Show me how
 next to the relevant filter to enable it:
Step 3 | Customize Your Data Snippets
Choose which data snippets appear in your dashboard and the order in which they display. Then choose the chart and SLA target types for each snippet.
To customize the data snippets in your dashboard:
- Choose what you want to do:
- Add data snippet: Click + Add Data Snippet at the top right. Then click Add next to the snippet you want to add to your dashboard.
- Reorder data snippets: Click the Reorder icon
 at the top left of a snippet, then drag it into a new location on your dashboard.
Tip: Click the Expand icon at the top right of the relevant snippet to enlarge or reduce its width.
 - Remove data snippet: Click the Show More icon
 on the top right of the snippet and select Remove from Dashboard.
- Select the relevant data snippet below to learn how to customize it:
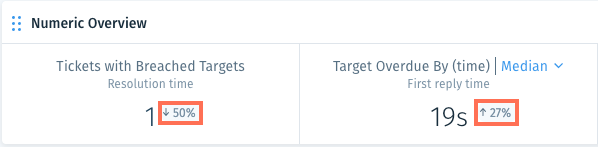
Numeric Overview

 to the right of Numeric Overview and choose an option:
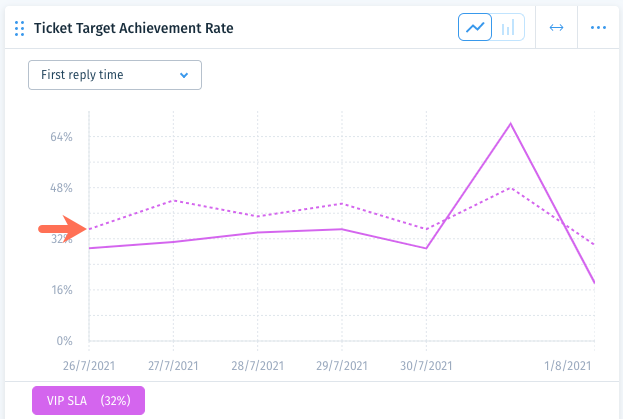
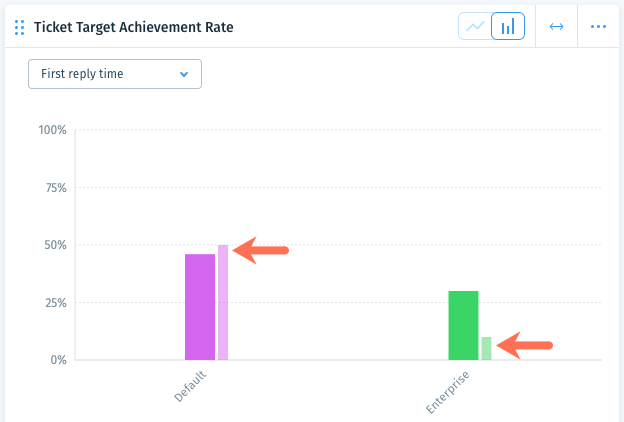
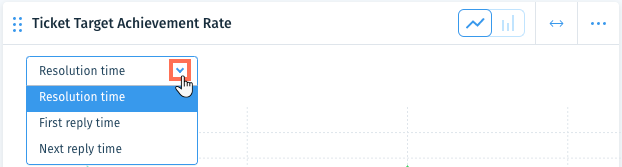
Ticket Target Achievement Rate
 or the Line Chart icon
  to view the relevant chart type.
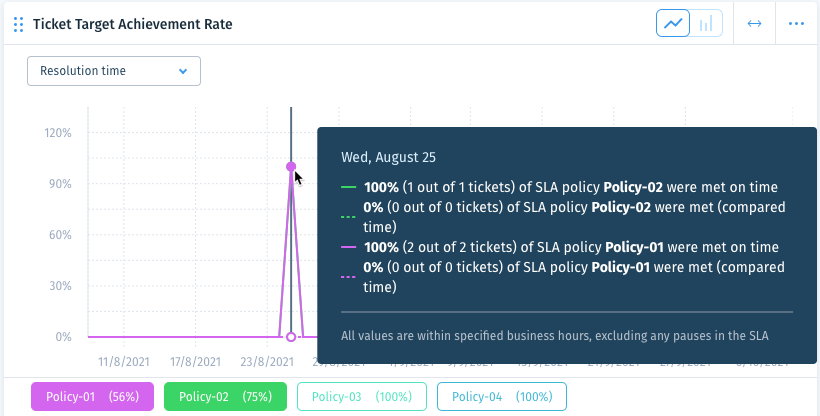
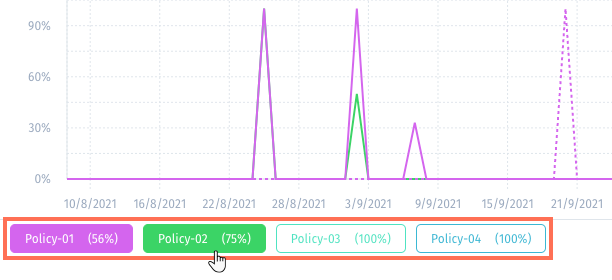
 to deselect them.
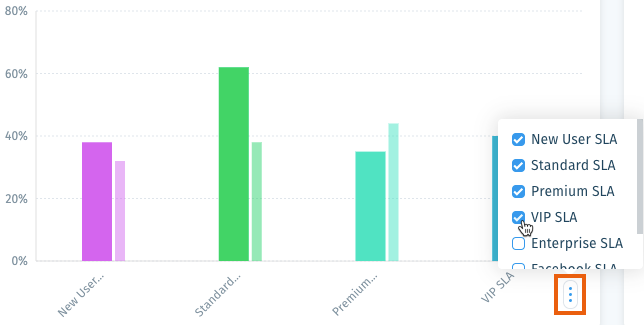
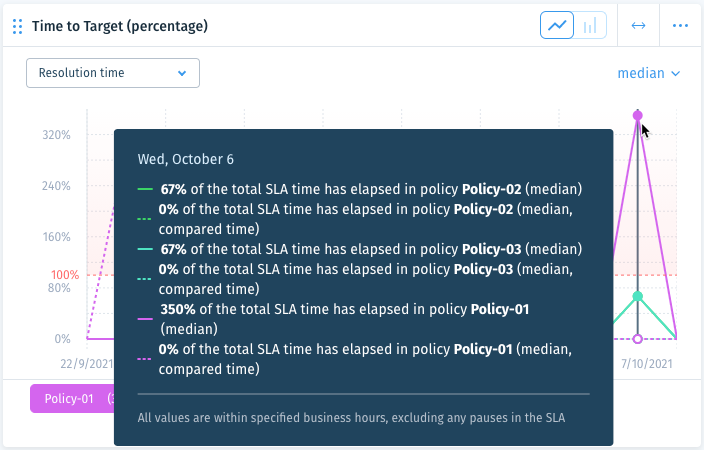
Time to Target (percentage)
Tickets with Breached Targets

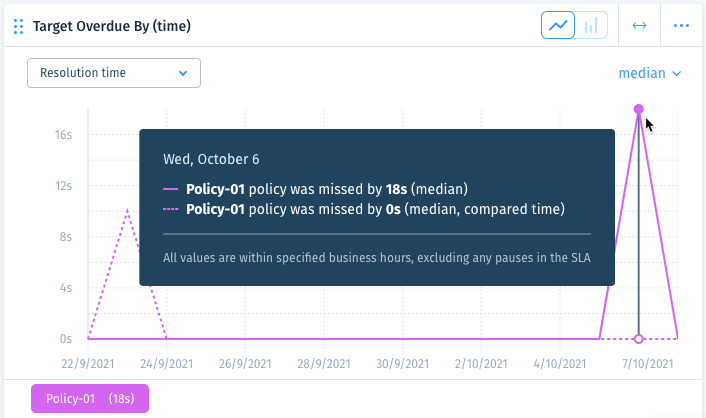
Target Overdue By (time)
Was this article helpful?