
Wix Answers Help Center
Team Performance Insights
Determine your best performing team members, groups, and locations with Team Performance Insights. Here you can measure efficiency using quantitative data in various, customizable chart types.
Ticket metric calculations:
Your Team Performance Insights dashboard includes all ticket types (deleted, merged, snoozed, spam) and tickets created/updated by team members, Automatic Actions, or Spotter. However, tickets created/updated by Automatic Actions or Spotter are excluded in the following data snippets:
- Agents Statistics: Stats are attributed to the team member who performed the relevant action.
- Groups Statistics: Stats attribute to all the groups of the team member who performed the relevant action.
Learn how ticket metrics are calculated differently in other areas of Wix Answers.
Hover over the Insights icon  and click Team Performance to get started.
and click Team Performance to get started.About Your Team Performance Data Snippets
Add various data snippets to your dashboard to interact with statistics in tables, line charts, bar charts, and heatmaps. Each snippet displays data according to the date ranges and filters you set, as well as the parameters you toggle within the snippet.
Display the following types of data snippets on your dashboard:
Metric Overview

 to the right and select each metric you'd like to display.
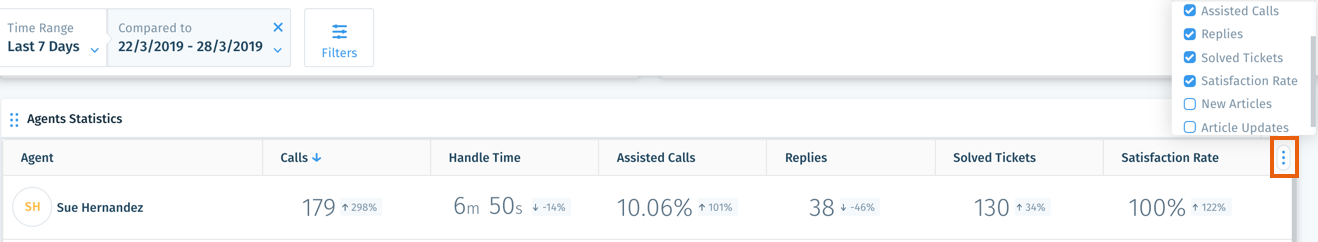
Call Center, Tickets, Knowledge Base, and Chat Metrics
 : View statistics over time within a line chart.
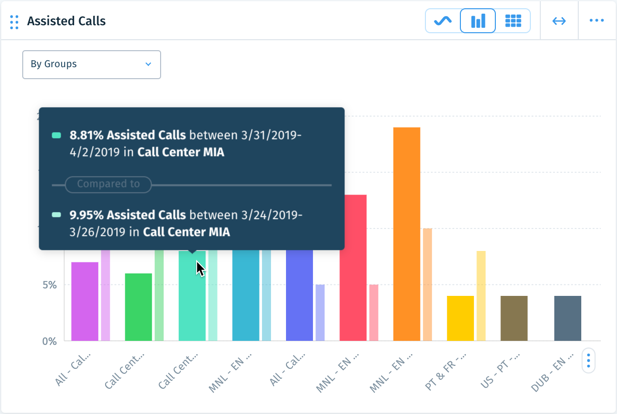
 : View statistics within an aggregated bar chart.
 : View cumulative data represented as colors within a matrix graph.
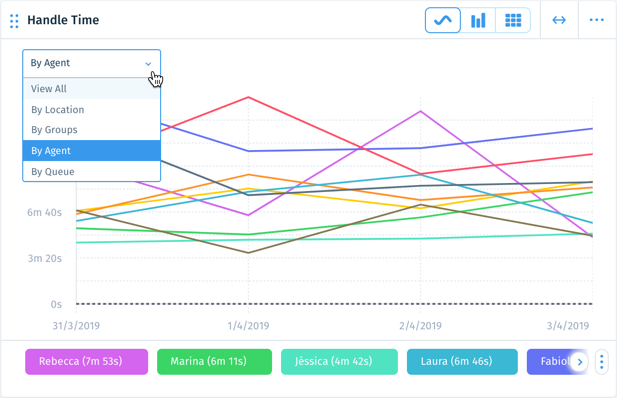
Managing Data Snippets on Your Dashboard
Easily add, remove, or rearrange the data snippets you'd like to focus on in your dashboard.
To add a data snippet:
- Click + Add Data Snippet at the top right of your dashboard.

- Click Add next to the relevant snippet.
To rearrange your dashboard:
- Click the Reorder icon
 at the top left of a data snippet.
 - Drag the data snippet into a new location on your dashboard.
Tip:
Click the Expand icon  at the top right of a snippet to enlarge or reduce its width.
at the top right of a snippet to enlarge or reduce its width. To remove a data snippet:
- Click the Show More icon
 on the top right of your data snippet.
 - Click Remove from Dashboard.
Filtering Your Team Performance Data
Gain valuable insight into your team's performance by comparing time ranges and adding filters. You can compare custom or preset time ranges, and add Groups and Locations filters.
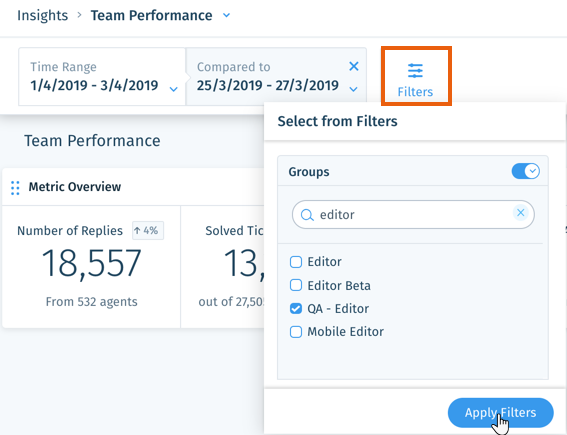
To add a filter:
- Click Filters at the top of the page.
- Click the Toggle
 next to each filter you'd like to add.
 - Select the relevant filters.
Tip: Click the Search field and type the name of a filter, then select it from the list. - Click Apply Filters.
Tip:
Click the X icon next to a filter to remove it, or click the Drop-down icon  to edit it.
to edit it. 
Available team performance filters:
- Time Range: Select a date range to analyze. Choose from preset time ranges or click the calendar to select a custom date range and click Apply.
- Compared to: Select the date range in which you're comparing your data.
- Location: Select the locations you'd like to include in your statistics.
- Group: Select the groups you'd like to include in your statistics.
Was this article helpful?