
Wix Answers Help Center
Insights Advanced Reports: Traffic Overview
Use the Traffic Overview report to gain a full picture of all your incoming and outgoing support tickets. View data from any date range in several charts with your choice of data point segmentation. You can breakdown the data by key variables such as ticket assignee, channel, language and more. Take an even closer look by drilling down into specific interactions and tickets.
Important:
Advanced Reports are not yet available in all Wix Answers accounts. Contact us if you would like to gain access to this feature.
Ticket metric calculations:
Your Insights Advanced Reports include merged, snoozed, and spam tickets. Deleted tickets are excluded from the reports. Learn how ticket metrics are calculated differently in other areas of Wix Answers.
To get started:
- Hover over the Insights icon
 in the side panel and click Advanced Reports.
 - Select the Traffic Overview report.
In this article, learn more about:
Filtering your Traffic Overview report
Add filters to your Traffic Overview report to fine-tune the data that appears in the charts. You can set the date range, group the data points, split the data with breakdown options, and more.
To filter the report:
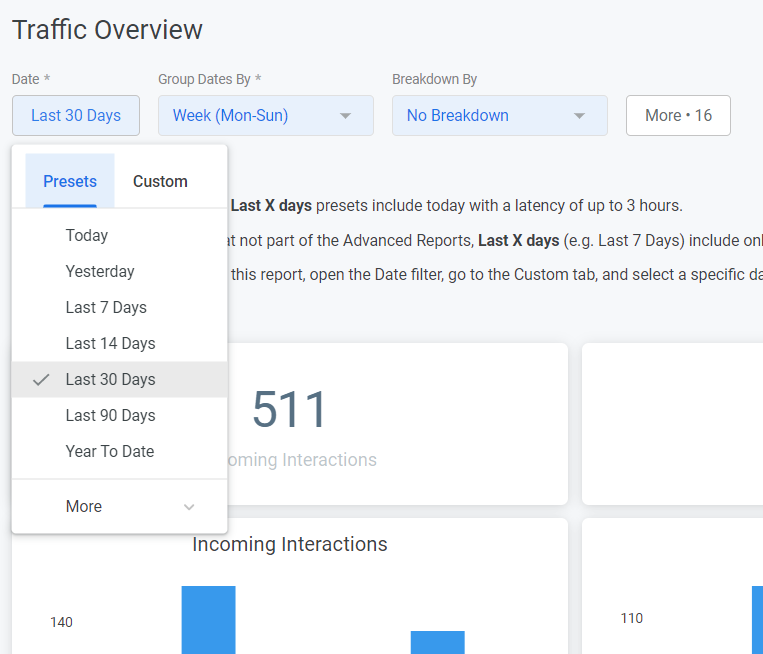
- Click the Date field and choose a date range for the data.
Tip: Click More to view more presets or click Custom to create a custom date range.
- Click the Group Dates By field and choose how the data points will be segmented in the charts.
For example: If the Date field is "Yesterday" and the Group Dates By field is "Hour", the graphs will display 24 data points (because there are 24 hours in a day).

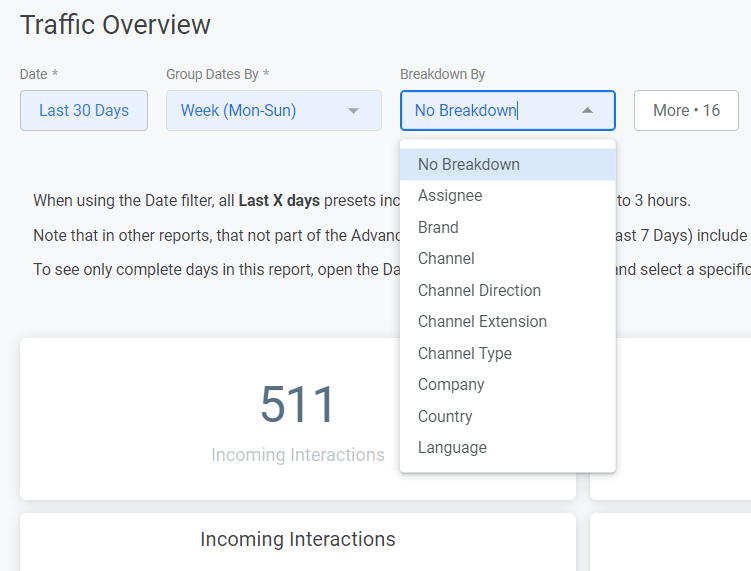
- (Optional) Add a Breakdown By filter to split the data in the charts.
Show me how
4. Add more filters.
Show me how

5. Click the Reload icon  at the top right to apply the filters to your report.
at the top right to apply the filters to your report. 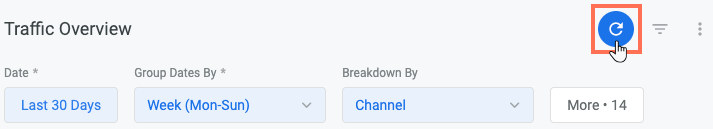
Tips:
- Click the Hide filters icon
 at the top right to hide or show your filters.
 - Click the Dashboard actions icon
 at the top right and select:
- Download: To download your report as a PDF or CSV file.
- Schedule delivery: To create a recurring schedule for sending your report via email.
- Reset filters: To remove the filters you've applied.
- Viewer time zone: To change the time zone of your report.
Working with your Traffic Overview tiles
Your Traffic Overview report consists of several tiles, each displaying data according to the date range and filters you set.
View the following tiles in your Traffic Overview report:
Incoming Interactions counter

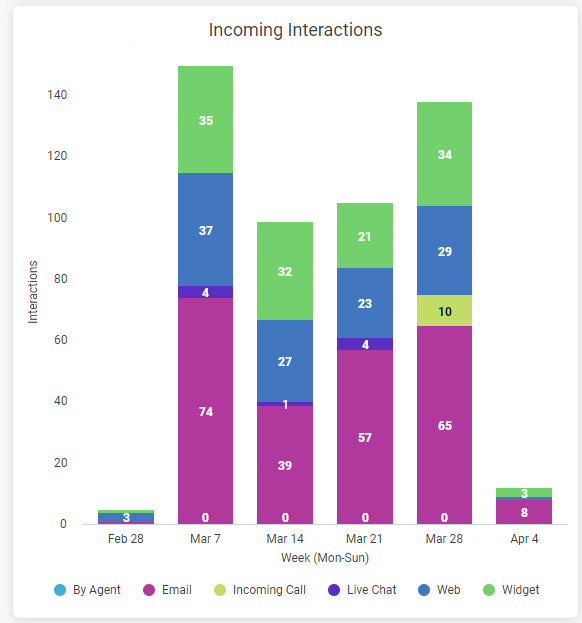
Incoming Interactions column chart

Ticket counter

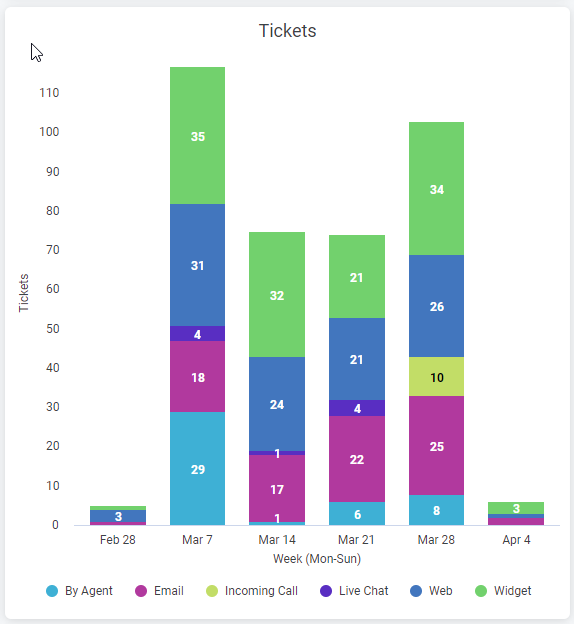
Tickets column chart
FCR Rate counter

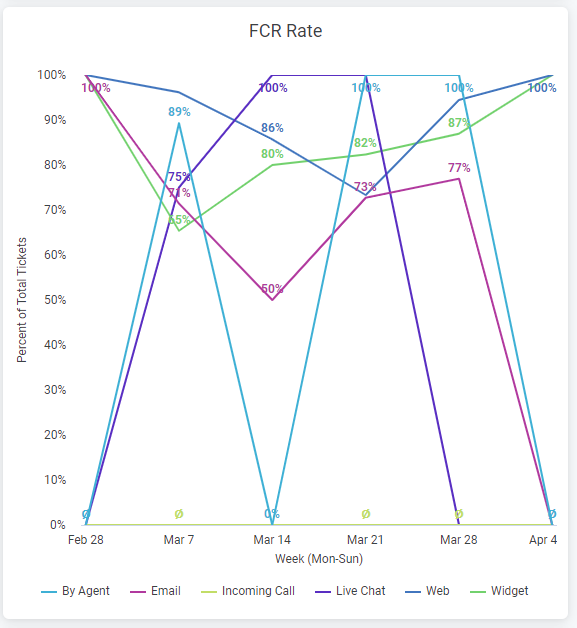
FCR Rate line chart
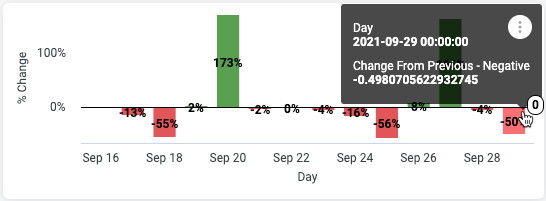
Percentage change charts
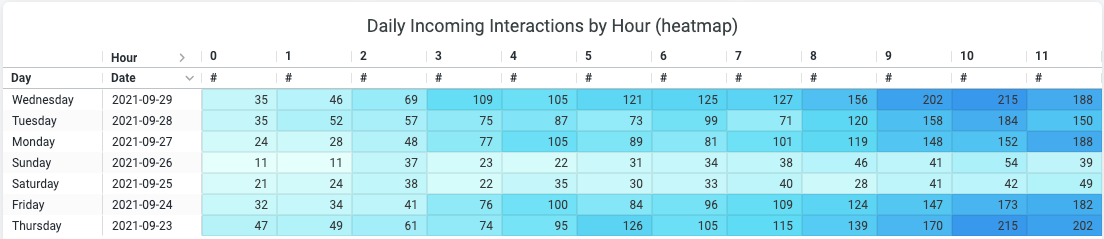
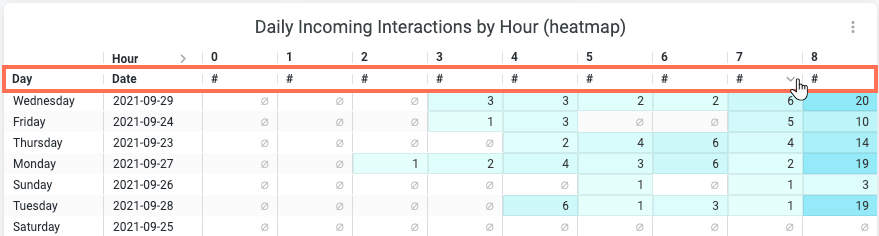
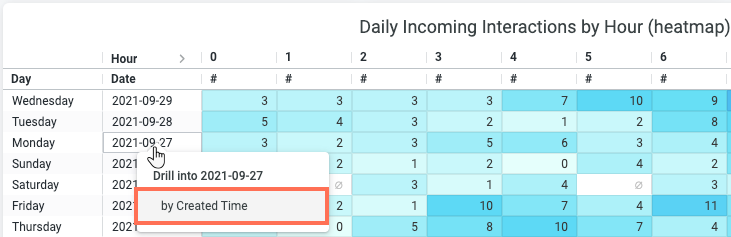
Daily Incoming Interactions by Hour (heatmap)
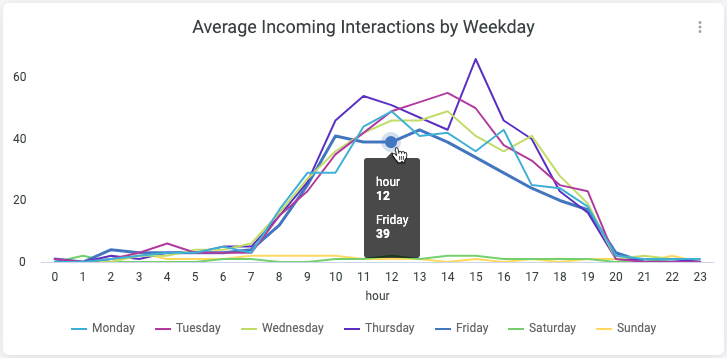
Average Incoming Interactions by Weekday
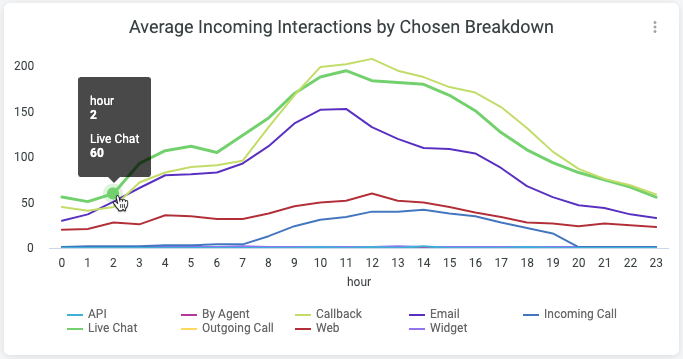
Average Incoming Interactions by Chosen Breakdown
Was this article helpful?